Project Overview
The System Process Viewer provides real-time visibility into Invoice OCR Scanner’s processes, enabling system administrators and finance managers to monitor performance, troubleshoot failures, and reallocate resources. As Lead Product Designer, I mentored another designer on the Architecture team over 9-12 months, working alongside development, operations teams, and a Product Manager to deliver a B2B internal utility application for enterprise invoice processing.
My Role: Senior Product Designer, mentoring and collaborating with another designer on the Architecture team
Timeline: 9-12 months (integrated with larger Invoice OCR Scanner product launch)
Team: Design team of 2, working with development and operations teams and a Product Manager
Product Type: B2B internal utility application for enterprise invoice processing, stored in the cloud
Problem
Invoice OCR Scanner processes thousands of invoices daily, extracting data automatically to eliminate manual entry. The system’s value depends entirely on speed. If the OCR doesn’t make users faster than manual processing, the product fails. However, two critical user groups had no visibility into system performance.
System administrators couldn’t identify stuck processes consuming cloud resources, spot patterns in OCR failures, diagnose bottlenecks, or monitor cloud resource issues on servers they couldn’t directly control. When OCR scans failed, admins discovered it only when users complained. They had to dig through server logs to understand what was happening, and resource waste occurred as stuck processes consumed cloud resources indefinitely with no monitoring.
Finance managers needed to verify processing speed met SLA requirements and identify when scans were slowing down, but they had no way to monitor system health without technical expertise. Through conversations with both user groups, we identified three critical needs: minimise user effort through automatic problem detection, focus on speed as the primary metric, and enable proactive problem detection before users noticed issues.
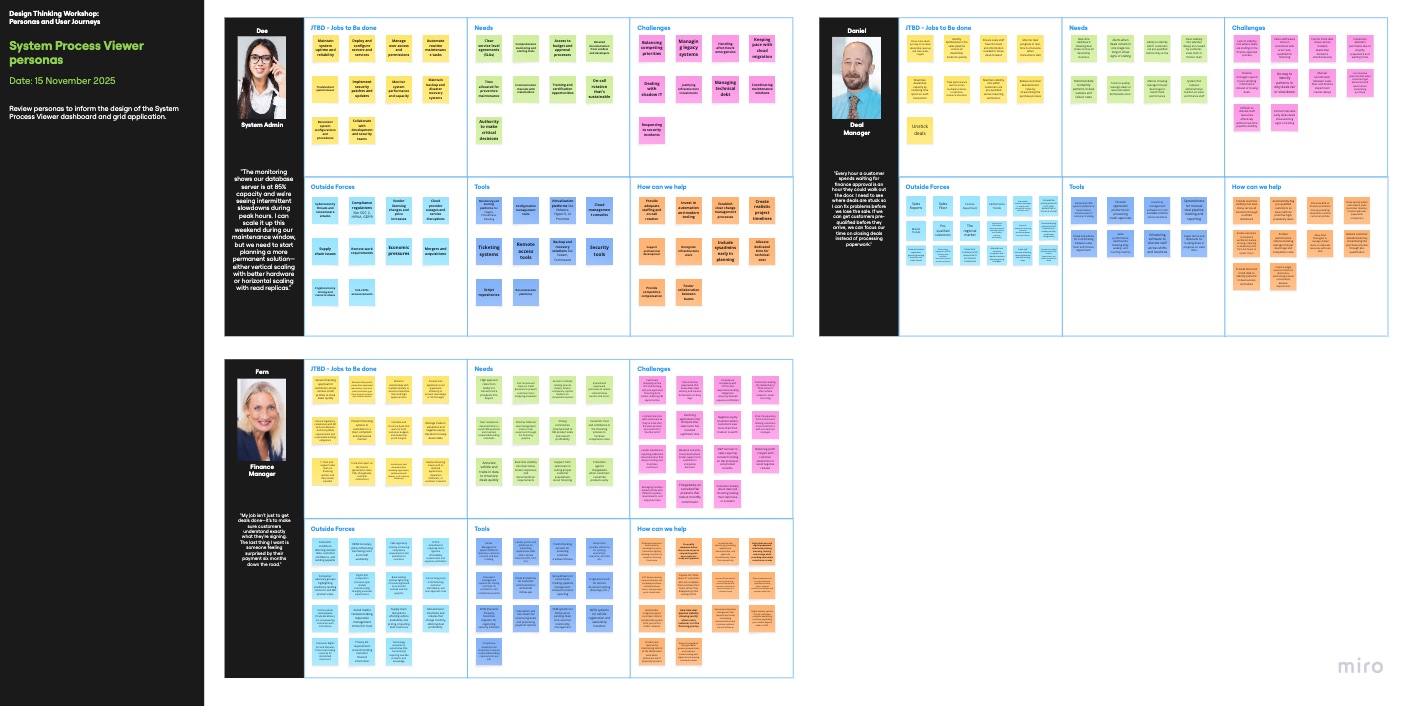
Personas
System Administrator
Responsible for maintaining system health and fixing technical issues. Needs to identify stuck processes, spot OCR failure patterns across invoice types and vendors, diagnose processing pipeline bottlenecks, and monitor cloud resource issues on servers without direct access. Must fix problems quickly before they impact users.
Finance Manager
Oversees invoice processing operations and ensures system delivers value. Needs to verify the OCR delivers on the “faster than manual” promise, confirm processing speed meets SLA requirements, and identify when and why scans are slowing down. Requires simple health indicators without needing technical expertise.
Deal Manager
Manages high-value invoice processing and client relationships. Needs confidence that critical invoices process accurately and quickly, visibility into processing status for time-sensitive deals, and ability to escalate issues before they impact client relationships.
User Journeys
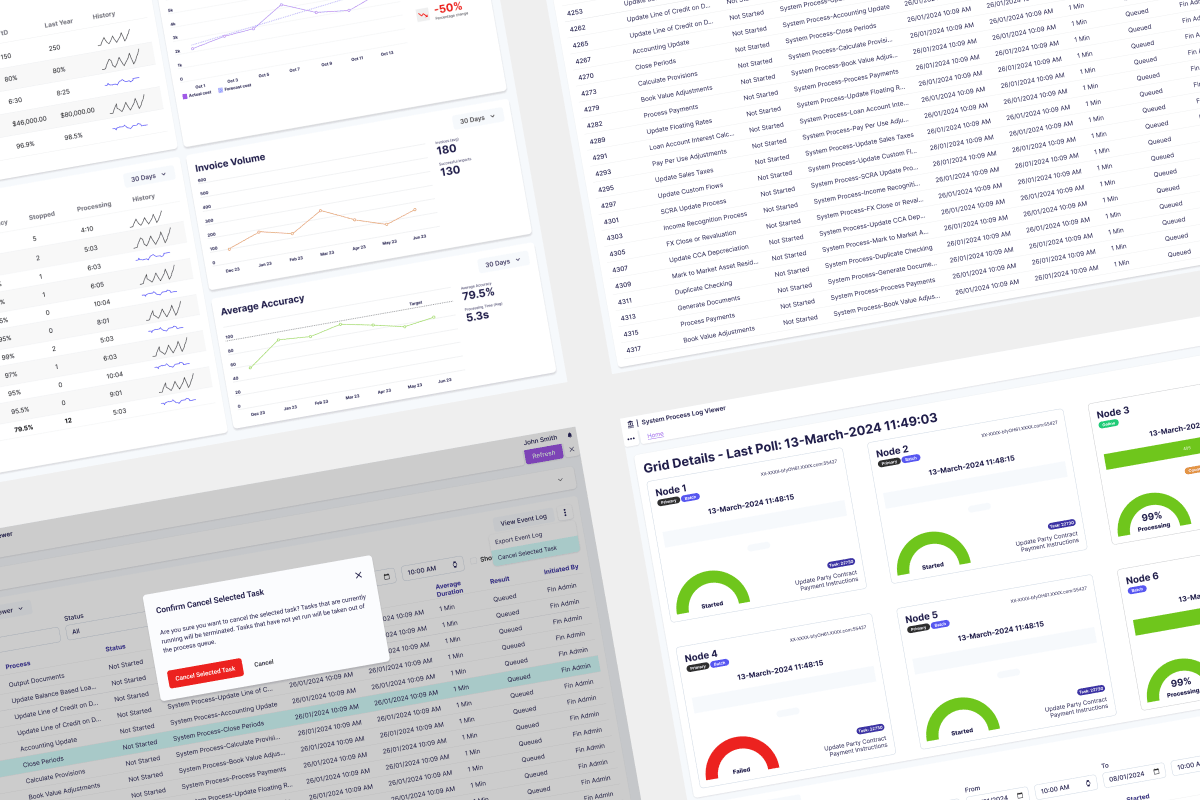
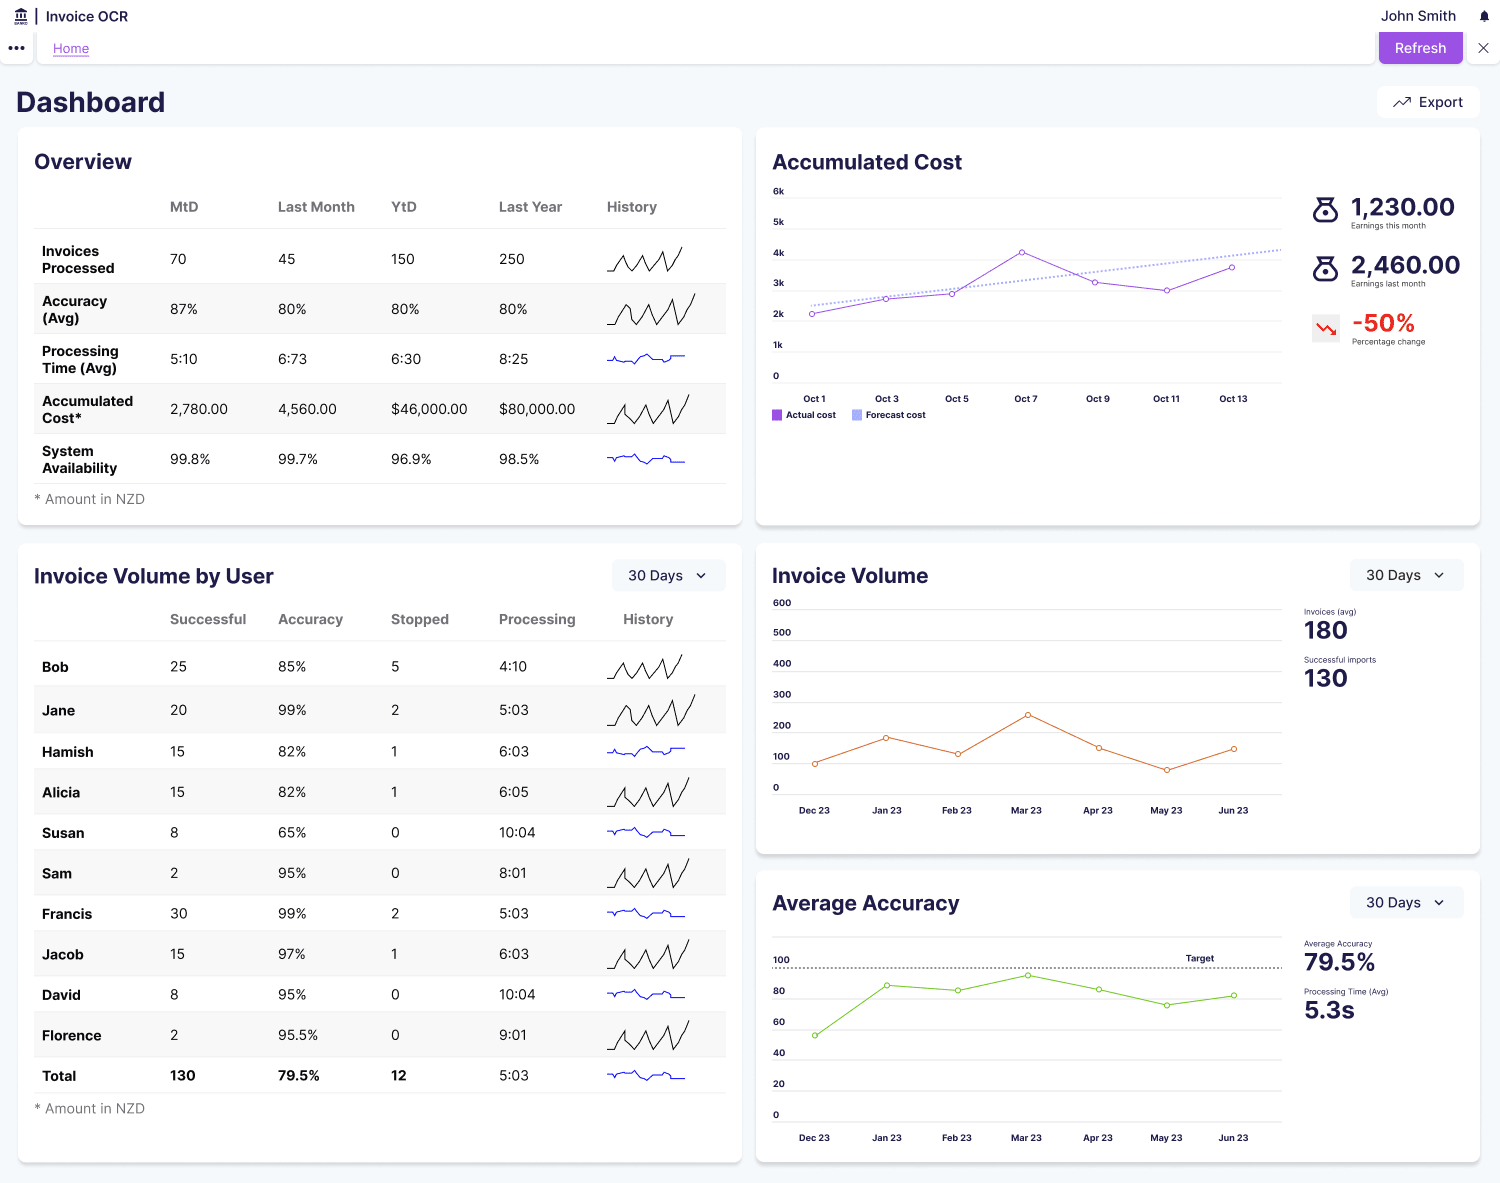
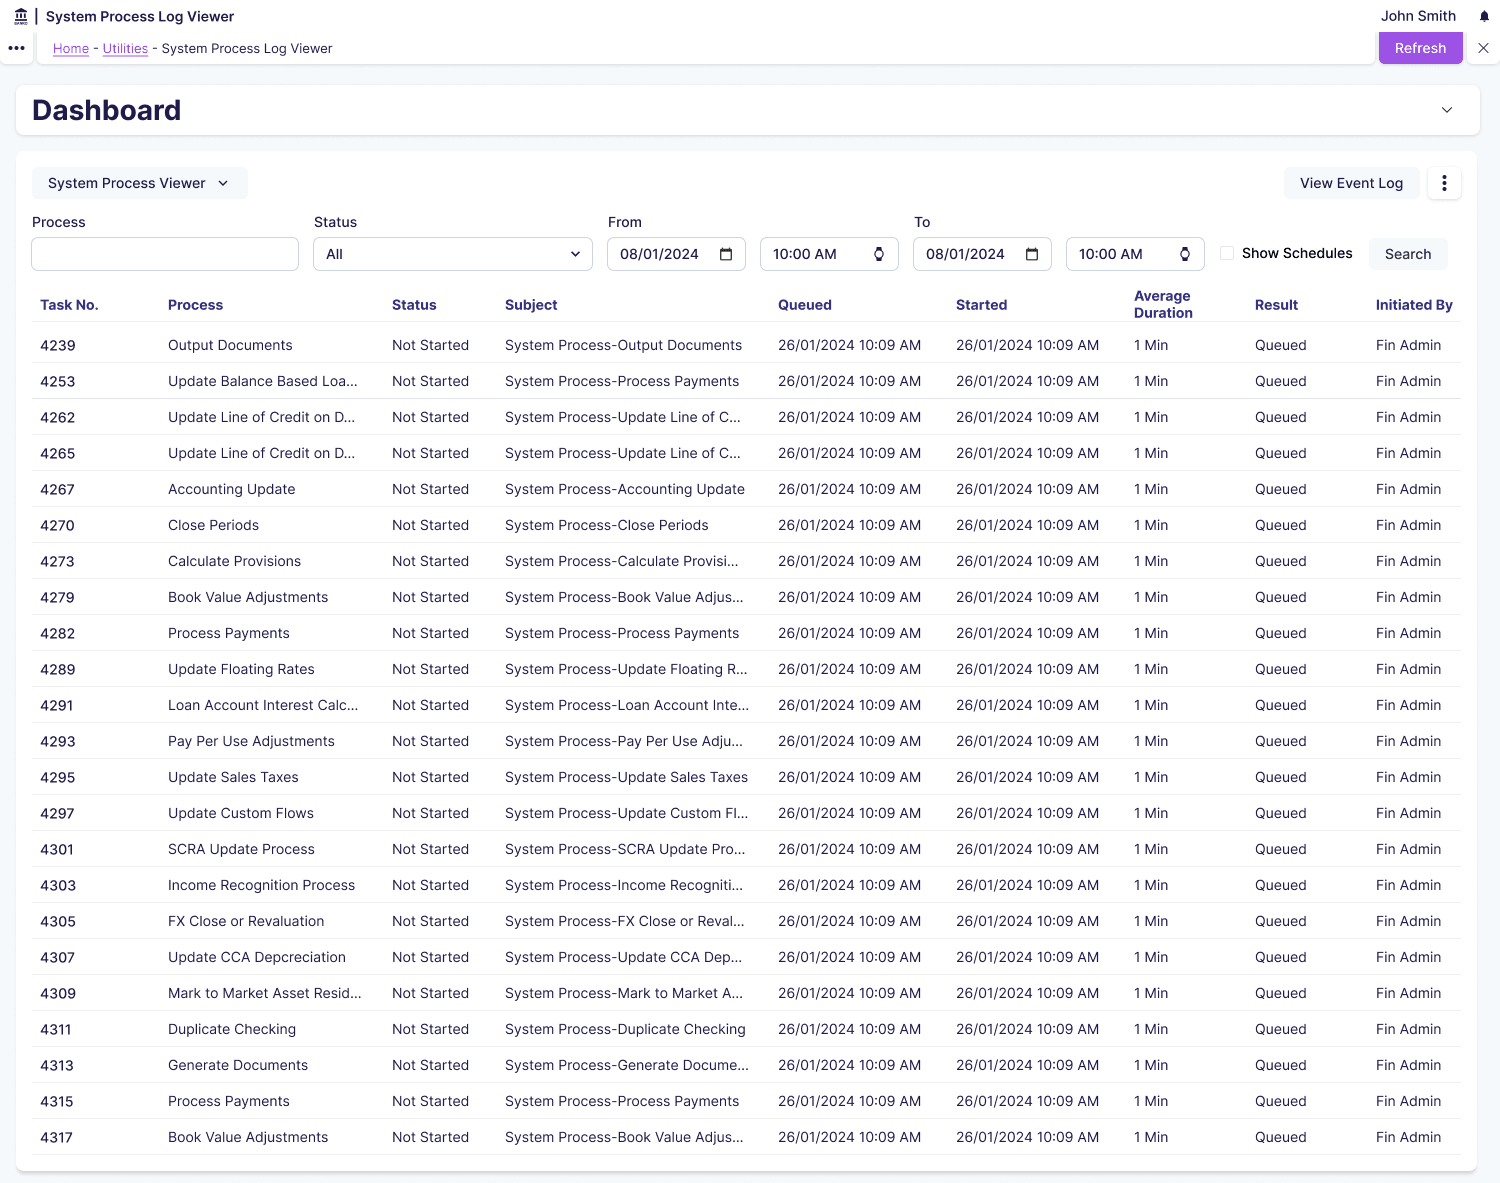
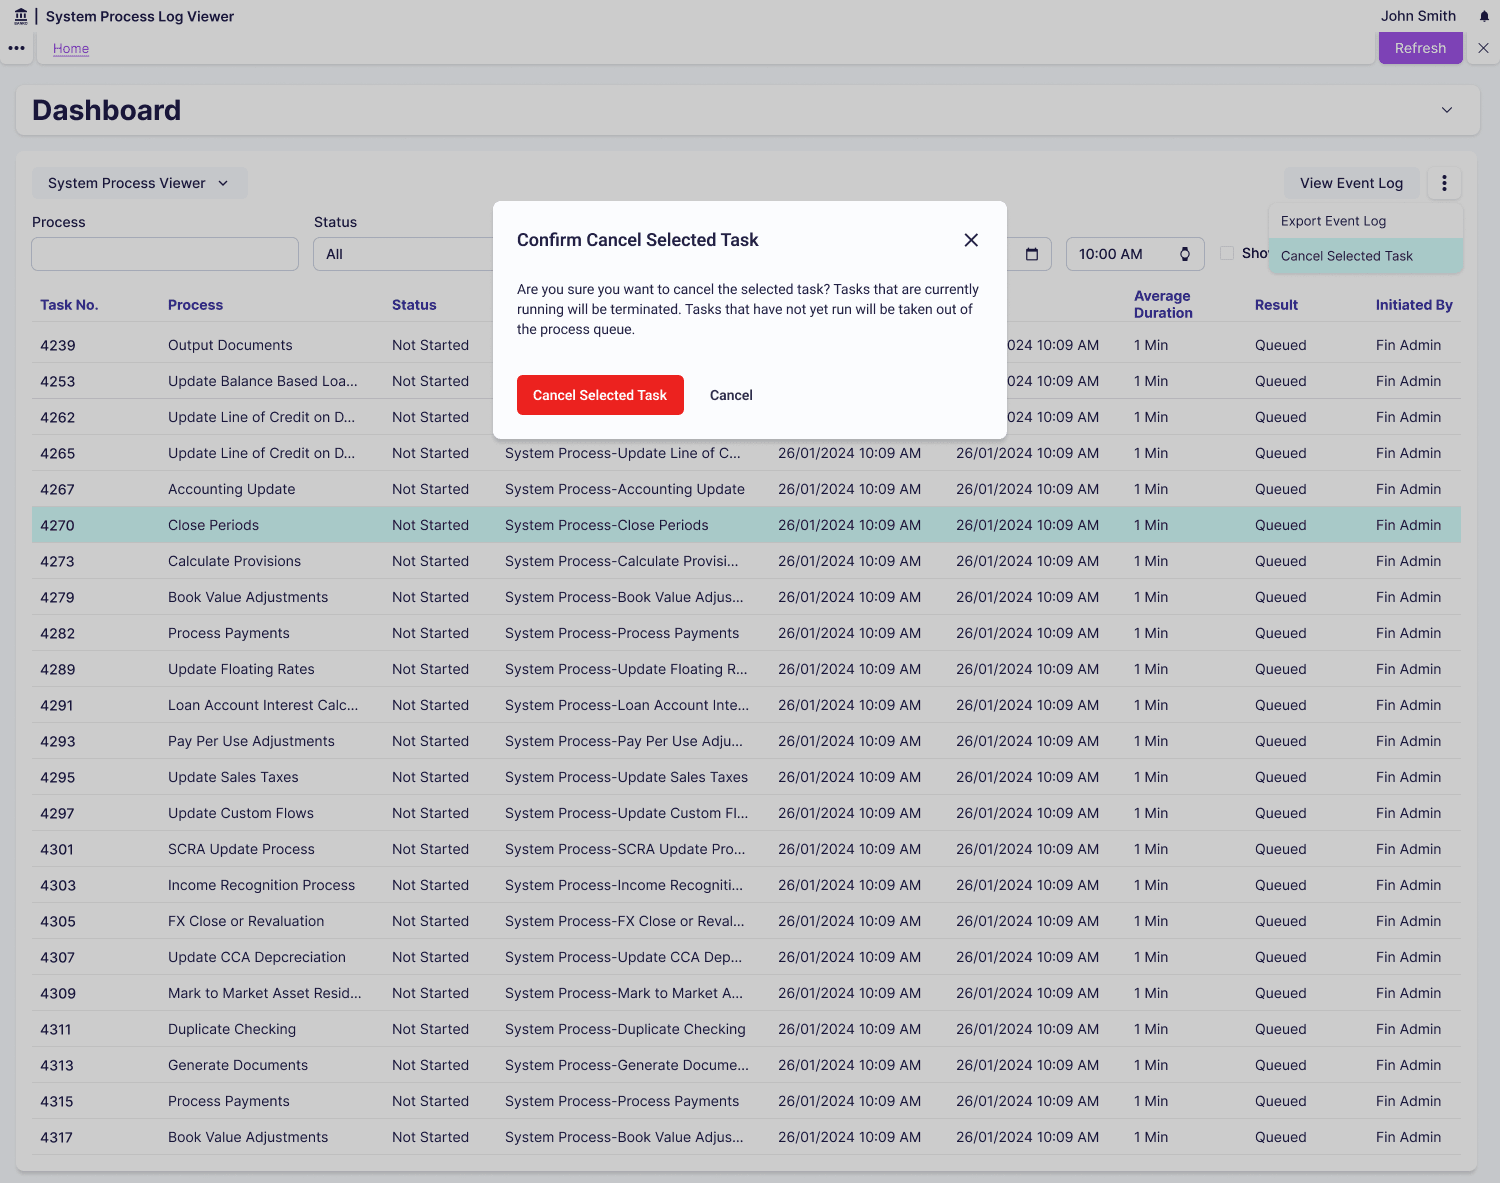
System administrators start their day by checking the System Process Viewer dashboard for any stuck or failed processes. When they identify issues through resource consumption charts showing flat lines (stuck processes), they drill into detailed logs to diagnose the root cause. They can cancel stuck processes to free resources and export filtered results to identify patterns over time, such as specific vendors consistently causing failures.
Finance managers periodically check processing speed against SLA requirements by filtering to view recent completed processes. They use health scores to quickly scan system status without understanding technical metrics. When processing slows down, they export CSV reports showing performance trends to share with leadership, demonstrating whether the OCR investment is delivering value.
Constraints
The most significant constraint shaped our entire design approach: we could track when processes started and their resource consumption, but we couldn’t predict when they would finish. Invoice complexity varied wildly (1-page vs 50-page documents), OCR processing time depended on document quality and format, and cloud resource allocation fluctuated based on overall system load. This made traditional progress indicators (0-100% complete, “5 minutes remaining”) impossible to implement.
We were working within an established enterprise utility application framework with existing design patterns, component libraries, and user expectations. This wasn’t a greenfield project where we could reimagine the entire experience. System admins needed visibility into cloud servers they didn’t have direct access to, and the monitoring had to surface issues without requiring them to SSH into servers or access AWS dashboards directly.
One interface had to serve both finance managers needing simple health indicators and system admins needing detailed diagnostic data, without overwhelming the less technical users. This mixed technical literacy requirement meant we needed progressive disclosure where both audiences could get what they needed from the same interface.
Solution
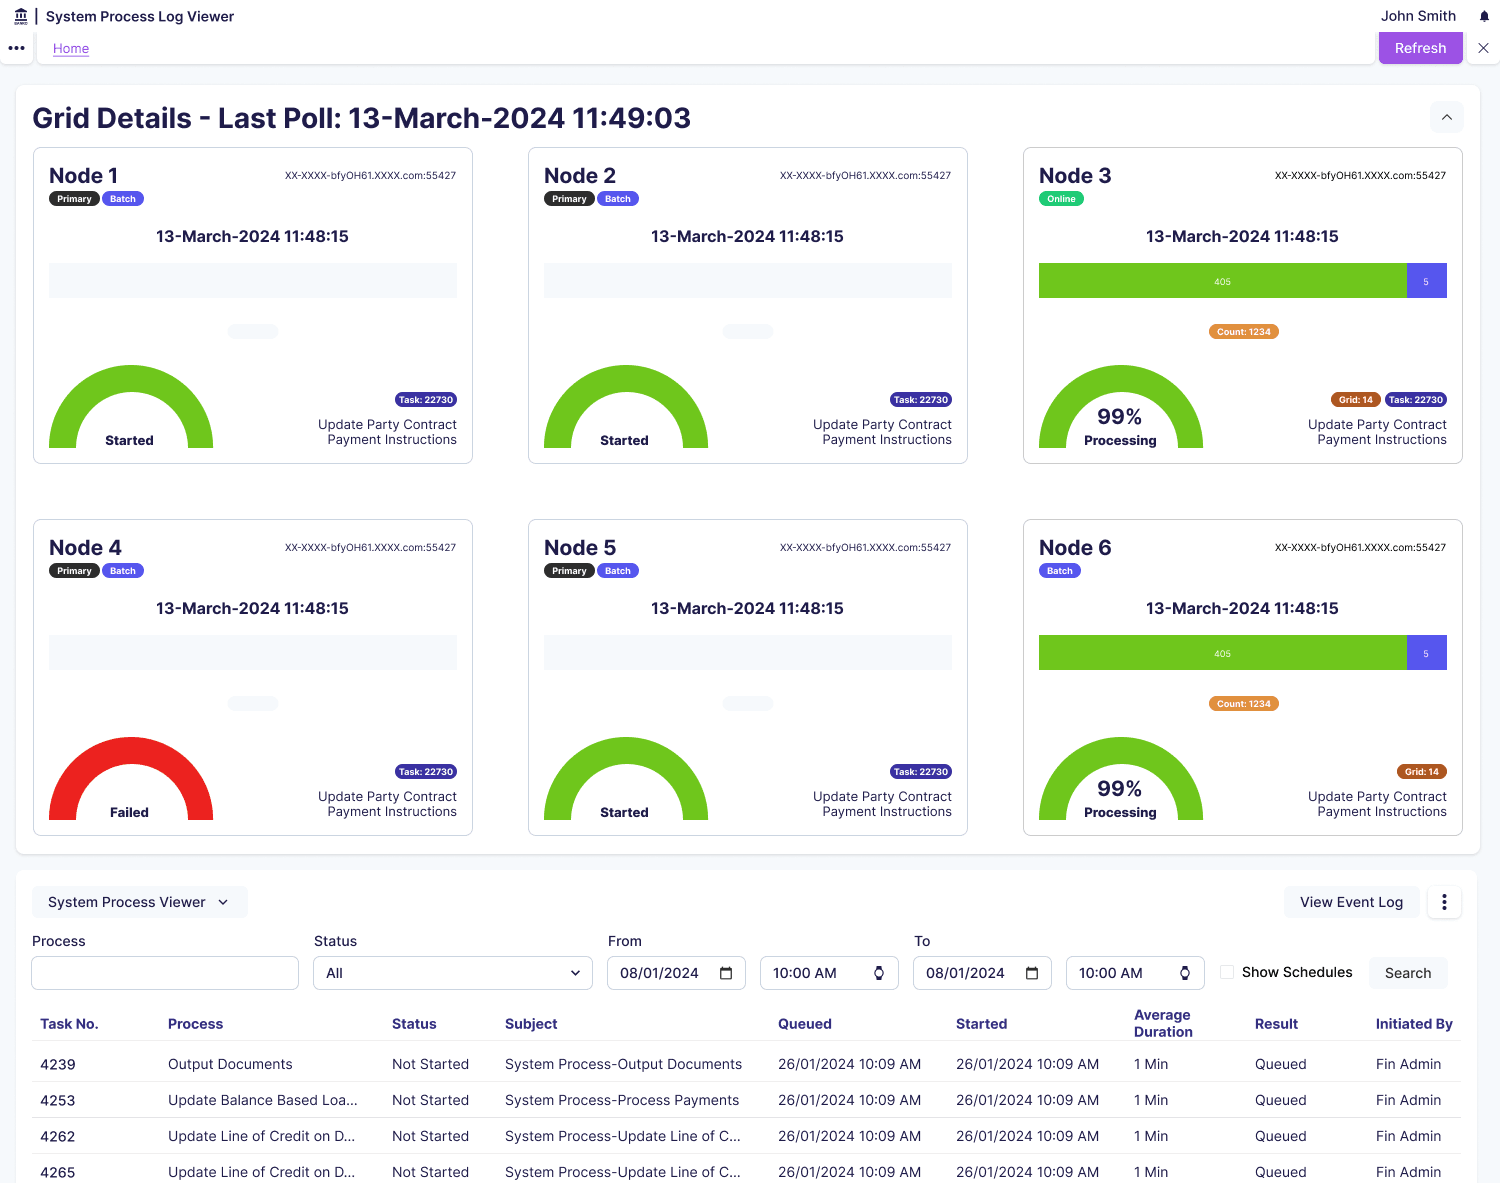
I reframed the mental model from “how long until it finishes?” to “how much is this process consuming?” We showed resource consumption (CPU usage, memory allocation, processing rate) rather than fake progress bars. This shift was crucial because a process using 0% CPU for 10 minutes is clearly stuck (actionable insight), whilst a process steadily consuming resources is healthy even if we can’t predict completion. Resource metrics help admins reallocate capacity, which they control. I also considered status-only approaches (Running, Completed, Failed) but didn’t go with these because users couldn’t tell if a “Running” process was healthy or stuck.
For filtering, I designed a hierarchical system where users select process type first (OCR Scan, Data Extraction, Validation, Export), then status (Running / Completed / Failed / Pending), then date range. This structure guides users through progressively more specific queries and enables CSV export for trend analysis in external tools. Finance managers typically check current status whilst system admins investigating issues use the full filtering power. I also considered simple current-state views showing only running processes, but didn’t go with this because users couldn’t identify patterns or troubleshoot past failures.
I applied progressive disclosure for process details: the primary view shows process name, status badge, duration, and resource consumption chart, whilst detailed logs and error messages appear on demand when users click to expand. Charts showing resource consumption over time tell a story where a steadily climbing line means healthy progress, a flat line means stuck, and a spike then drop means completed. I also considered showing all attributes in a comprehensive data table, but didn’t go with this because it was overwhelming and difficult to spot problems at a glance.
Learnings
Building on the success of the System Process Viewer, I’d prioritise proactive alerting earlier in future projects. Threshold-based alerts that notify admins when metrics exceed defined thresholds (such as more than 5 processes stuck for over 30 minutes) would amplify the value of the monitoring system. This experience reinforced that when users explicitly request proactive problem detection, integrating that capability from launch creates immediate impact rather than requiring them to adapt their workflows twice.
I’d invest more time exploring technical approaches to processing time prediction with the engineering team. Questions worth pursuing include building machine learning models based on historical processing times, providing rough completion estimates with confidence intervals, or categorising invoices by complexity upfront for category-specific estimates. Whilst resource-based metrics successfully served system admins, finance managers valued completion estimates, and deeper technical exploration early could serve both audiences even better.
I’d expand the filtering system’s power by adding an “Attention Required” dashboard as the default view that proactively surfaces problems. This would automatically highlight stuck processes, excessive resource consumption, unusual patterns, and recent failures whilst keeping the flexible filtering available for deeper investigation. This experience taught me that the most powerful tools combine proactive intelligence with on-demand flexibility, minimising the effort users expend whilst maximising the insights they gain.